
PetrolTight
3.20weeks
Projected stock-out11th October 2026
The industry oversight section provides petroleum sector data including annual import quantities, annual sales volumes, weekly stock updates and OMC market share information.
Data published to support transparency, compliance oversight and public confidence in the downstream petroleum sector.
Current product availability data supports early visibility of supply conditions and helps the public understand national stock status.
Current national product stock levels and projected stock-out dates published for public supply visibility.
| Product | Total Stock | Available Stock | Projected Stock-Out |
|---|---|---|---|
| Petrol | 17,019,914 Litres | 3.20 weeks | 11th October 2026 |
| Diesel | 50,965,841 Litres | 9.40 weeks | 23rd November 2026 |
| Jet A1/Kero | 3,838,137 Litres | 7.40 weeks | 10th November 2026 |
| Marine Fuel Oil | 5,497,972 Litres | 8.40 weeks | 16th November 2026 |
| LPG/Cooking Gas | 686,166.00 Kg | 11.80 weeks | 30th November 2026 |
A compact summary of the latest reporting year, published product imports and aggregate sales volumes.
Reporting year currently covered by the Authority’s published industry records.
Published import total for 2026.
Aggregate sales reported for 2026.
Published pricing formula component values used for petroleum price structure transparency. Administrative fields are not displayed in this public table.
The table presents the component, unit or basis, and product-specific values for petrol, diesel, kerosene and fuel oil.
| Component | Unit or Basis | Petrol Value | Diesel Value | Kerosene Value | Fuel Oil Value |
|---|---|---|---|---|---|
| Av. Platts Prices - FOB MED | USD per MT | 1285.75 | 1438.75 | 1471.50 | 562.50 |
| Freight & Premium | USD per MT | 80.00 | 85.00 | 69.00 | 103.50 |
| C&F (Freetown) | USD per MT | 1365.75 | 1523.75 | 1540.50 | 666.00 |
| Insurance Cost - 0.15% of C&F | USD per MT | 2.05 | 2.29 | 2.31 | 1.00 |
| Import Duty 5% C-I-F | USD per MT | 68.39 | 76.30 | 77.14 | 33.35 |
| Ocean Loss Allowance - 0.3% of Items 3 + 4 | USD per MT | 4.10 | 4.58 | 4.63 | 0.00 |
| Storage | USD per MT | 4.70 | 4.70 | 4.70 | 4.70 |
| Port Charges | USD per MT | 3.50 | 3.50 | 3.50 | 2.00 |
| Jetty Charges | USD per MT | 25.00 | 25.00 | 25.00 | 25.00 |
| Freight Levy | USD per MT | 2.00 | 2.00 | 2.00 | 2.00 |
| Other Charges (transfer & Agency Fees, etc.) | USD per MT | 7.30 | 7.30 | 7.30 | 7.30 |
| Landed Cost | USD per MT | 1482.79 | 1649.42 | 1667.08 | 741.35 |
| Conversion | Litre/MT | 1362.00 | 1162.24 | 1248.50 | 1071.44 |
| Landed Cost | USD/Litre | 1.09 | 1.42 | 1.34 | 0.69 |
| Exchange Rate Adjustment | Le/USD | 23.86 | 23.86 | 23.86 | 23.86 |
| Landed Cost | Le/Litre | 25.98 | 33.86 | 31.86 | 16.51 |
| Distribution Cost | Le/Litre | 5.22 | 5.22 | 5.22 | 5.22 |
| Debt Recovery | Le/Litre | 0.00 | 0.00 | 0.00 | 0.00 |
| Petroleum Fund | Le/Litre | 0.40 | 0.40 | 0.40 | 0.40 |
| Excise Duty | Le/Litre | 5.00 | 5.00 | 2.00 | 7.40 |
| Road User Charge | Le/Litre | 0.70 | 0.50 | 0.00 | 0.00 |
| Uniform Price Adjustment Factor | Le/Litre | 0.07 | 0.07 | 0.07 | 0.00 |
| Infrastructure Development Fund (IDF) Provisions | Le/Litre | 3.44 | 1.48 | 2.20 | 1.47 |
| Price Correction Levy | Le/Litre | 0.00 | 0.00 | 0.00 | 0.00 |
| Fuel Marking | Le/Litre | 0.24 | 0.24 | 0.24 | 0.24 |
| Subsidy | Le/Litre | -1.04 | -1.76 | 0.01 | 0.76 |
| Full Pass-Through Pump Prices | Le/Litre | 40.00 | 45.00 | 42.00 | 32.00 |
NPRA monitors and reports annual importation of petroleum products to support transparency and efficiency in Sierra Leone’s downstream industry.
Import quantities are sorted by year from newest to oldest and grouped by product category.
| Year | Period | Petrol | Diesel | Jet A1 / Kerosene | Fuel Oil | LPG | Total |
|---|---|---|---|---|---|---|---|
| 2026 | 70,461.592 | 148,045.539 | 7,400.169 | 86,627.648 | 2,362.462 | 314,897.410 | |
| 2025 | 182,863.546 | 254,478.977 | 11,983.986 | 101,230.563 | 4,114.873 | 554,671.945 | |
| 2024 | 190,775.719 | 245,701.523 | 5,903.257 | 92,247.940 | 3,440.849 | 538,069.288 | |
| 2023 | 178,116.919 | 241,804.296 | 4,212.229 | 85,995.215 | 3,901.018 | 514,029.677 | |
| 2022 | 163,224.915 | 224,308.909 | 5,478.277 | 80,074.781 | 3,387.448 | 476,474.330 | |
| 2021 | 178,138.176 | 192,460.007 | 3,615.204 | 107,095.781 | 4,608.167 | 485,917.335 | |
| 2020 | 155,825.259 | 173,800.604 | 2,770.246 | 99,984.749 | 4,586.850 | 436,967.708 | |
| 2019 | 147,858.208 | 155,129.068 | 2,953.888 | 85,633.050 | 3,647.864 | 395,222.078 | |
| 2018 | 142,836.370 | 146,013.418 | 6,389.001 | 47,767.189 | 2,888.951 | 345,894.929 | |
| 2017 | 137,737.940 | 171,266.417 | 3,815.883 | 43,964.091 | 2,418.064 | 359,202.395 | |
| 2016 | 154,437.958 | 186,786.863 | 5,343.436 | 31,588.219 | 0.000 | 378,156.476 | |
| 2015 | 130,558.218 | 165,751.761 | 7,694.686 | 43,152.302 | 0.000 | 347,156.967 | |
| 2014 | 109,451.550 | 215,767.441 | 14,181.965 | 44,662.724 | 0.000 | 384,063.680 | |
| 2013 | 110,423.858 | 236,282.695 | 14,050.960 | 29,980.402 | 0.000 | 390,737.915 |
Annual volume sales reporting supports transparency, fair market practices and a clearer view of downstream sector performance.
| Year | Period | PMS | AGO | KERO | MFO | JET A1 | Aggregate |
|---|---|---|---|---|---|---|---|
| 2026 | 85,450,128 | 148,416,746 | 144,900 | 48,207,210 | 6,474,000 | 288,692,984 | |
| 2025 | 207,628,090 | 284,959,721 | 282,250 | 47,682,263 | 13,245,812 | 553,798,136 | |
| 2024 | 224,938,430 | 271,850,209 | 330,900 | 21,677,031 | 6,015,000 | 524,811,570 | |
| 2023 | 226,501,241 | 251,747,412 | 513,400 | 24,706,207 | 4,348,000 | 507,816,260 | |
| 2022 | 218,667,540 | 246,929,065 | 639,510 | 21,761,090 | 6,812,000 | 494,809,205 | |
| 2021 | 240,626,268 | 231,521,915 | 876,060 | 26,775,480 | 3,626,000 | 503,425,723 | |
| 2020 | 205,521,072 | 196,205,793 | 714,320 | 11,498,930 | 2,144,000 | 416,084,115 | |
| 2019 | 193,267,786 | 189,392,882 | 681,410 | 19,800,890 | 4,775,552 | 407,918,520 | |
| 2018 | 182,174,539 | 183,936,885 | 1,157,278 | 35,679,370 | 6,092,000 | 409,040,072 | |
| 2017 | 139,808,270 | 253,166,119 | 2,561,625 | 30,920,270 | 15,552,108 | 442,008,392 | |
| 2016 | 206,049,802 | 209,564,190 | 1,349,496 | 36,468,227 | 4,895,200 | 458,326,915 | |
| 2015 | 186,971,518 | 188,302,114 | 1,997,469 | 41,414,065 | 8,098,100 | 426,783,266 | |
| 2014 | 149,529,702 | 254,622,883 | 2,075,638 | 41,314,445 | 14,540,400 | 462,083,068 | |
| 2013 | 139,808,270 | 253,166,119 | 2,561,625 | 30,920,270 | 15,552,108 | 442,008,392 |
 9 July 2026
NPRA Director General Brima Baluwa Koroma briefed Parliament's Committee on Trade and Industry on developments in Sier…
 23 June 2026
NPRA Director General Baluwa Koroma engaged development partners and members of the Sierra Leonean diaspora at the ina…
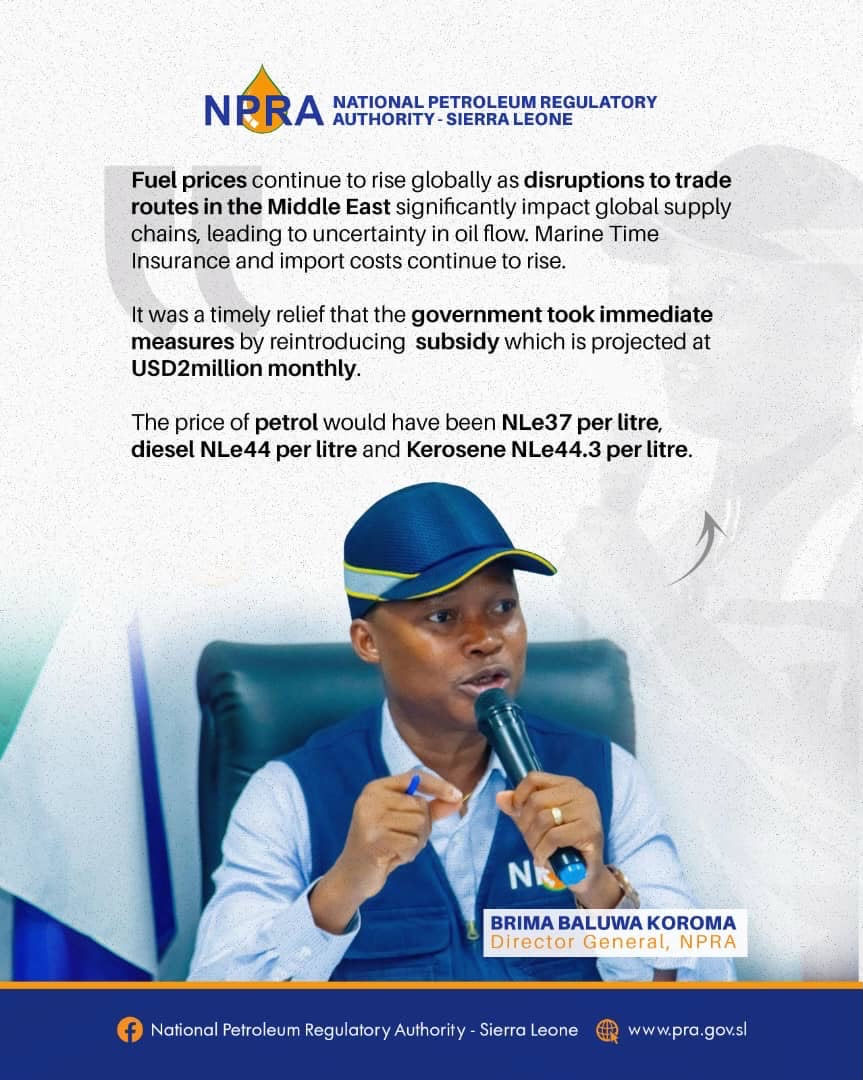 20 June 2026
The National Petroleum Regulatory Authority (NPRA) has announced that the Government of Sierra Leone's fuel subsidy pr…
Quick answers to common public and operator questions about licensing, pricing and downstream petroleum regulation.
View all FAQs ↗A fuel subsidy is financial support provided by the Government to reduce the cost of petroleum products paid by consumers.
Yes. Fuel prices are approved by the Government using the approved pricing formula to ensure fair, transparent and sustainable pricing.
Fuel prices are determined using an approved pricing formula. The formula takes into account the international reference price for refined petroleum products (Platts), published by S&P Global, the exchange rate provided by the Bank of Sierra Leone, and other costs incurred throughout the petroleum supply chain.
Fuel prices are reviewed periodically to minimise the impact of short-term international market fluctuations and promote price stability.